
How El Niño and La Niña effect tropical storms
As a sailor, I am obviously concerned with tropical storms. These are my notes and “borrowed information” on how El Niño and La Niña effect tropical storms. In the Caribbean, we will probably haul out each hurricane season either in Grenada/Trinadad or in North Carolina. If we cross the Pacific, we’re going to need to worry about tropical storms. I’m not thrilled with the idea of crossing the Pacific in a single year. I would like to spend two years in French Poly, a season in Tonga with a loop through New Zealand, a season in Fiji then north to the Marshals, returning through New Cal and the Solomons ending up in Oz (probably for a refit). That tentative schedule is designed to put us outside of the tropical storm areas during the peak seasons. Based on the information below, we would want to leave Panama with ENSO at Neutral and trending to La Niña. Another thought is that the safer option, considering the French Poly plan is to spend the first year in the Tuamotus, that we would want to leave Panama with La Niña firmly established.
In the Caribbean, El Niño is better than La Niña
In the Caribbean, El Niño means weaker storms and La Niña means stronger storms. El Niño produces stronger westerly winds at upper levels of the atmosphere across the tropical Atlantic. This increases the vertical wind shear, basically shearing the tops from developing storms before a healthy circulation can form. El Niño events generally suppress Atlantic hurricane activity so fewer hurricanes than normal form in the Atlantic during August to October, the peak of Atlantic hurricane season. During La Niña, westerly winds high in the atmosphere weaken. This results in an expanded area of low vertical wind shear, allowing more Atlantic hurricanes to develop. La Niña not only increases the number of hurricanes that develop but may allow stronger hurricanes to form.
El Niño and La Niña also influence where Atlantic hurricanes develop. During La Niña, more hurricanes form in the deep Tropics from weather disturbances that originate over North Africa. These systems, called Cape Verde hurricane, have a much greater likelihood of becoming major hurricanes, and of eventually reaching the U.S. and the Caribbean Islands as there is greater distance and time for the storm to progress from tropical wave to tropical depression (≤33kts) to tropical storm (34-63kts) to a hurricane (64-95kts) and eventually to a major hurricane (≥96kts).
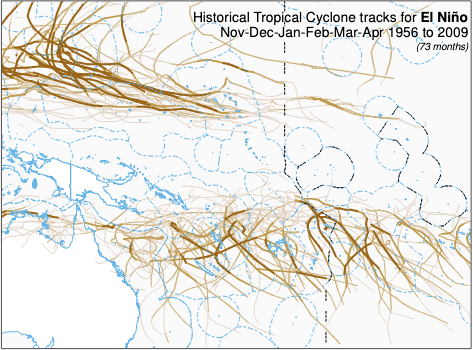
In the South Pacific, La Niña is better than El Niño
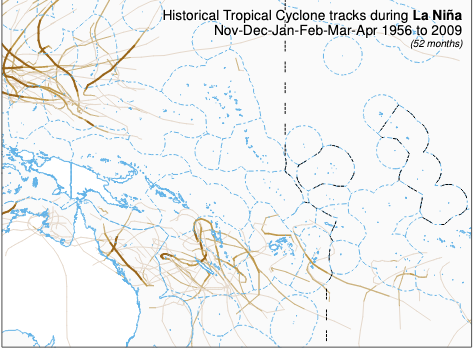
La Niña has opposite impacts across the Pacific and Atlantic basins. In the Pacific during La Niña, the area of tropical convection and its Hadley circulation is retracted westward to the western Pacific and Indonesia, and the equatorial Walker circulation is enhanced. Convection is typically absent across the eastern half of the equatorial Pacific.
In the upper atmosphere, these conditions produce an amplified trough over the subtropical Pacific in the area north of the suppressed convection, and a downstream ridge over the Caribbean Sea and western tropical Atlantic. Over the central and eastern subtropical Pacific, the enhanced trough is associated with stronger upper-level winds and stronger vertical wind shear, which suppress hurricane activity. Over the Atlantic basin, the anomalous upper-level ridge is associated with weaker upper- and lower- level winds, both of which reduce the vertical wind shear and increased hurricane activity. La Niña also favors increased Atlantic hurricane activity by decreasing the amount of sinking motion and decreasing the atmospheric stability.
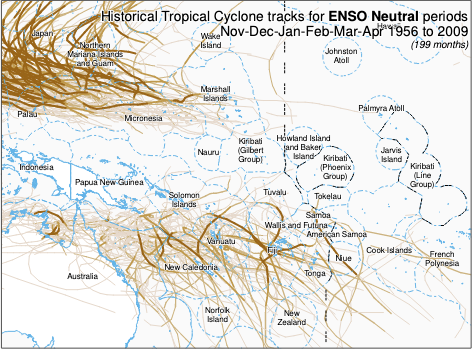
ENSO Neutral
Although hurricanes occur more often during La Niña episodes, significant tropical weather events have occurred during the neutral phase. For example, the record shattering 2005 hurricane season that included Katrina and Rita occurred during the neutral phase. And in 1992, Hurricane Andrew, the most destructive United States hurricane of record, made landfall along the Gulf coast during a neutral phase of the El Niño-Southern Oscillation.
What are El Niño and La Niña?
El Niño añd La Niña are naturally occurring phenomena that result from interactions between the ocean surface and the atmosphere over the tropical Pacific. Changes in the ocean surface temperatures affect tropical rainfall patterns and atmospheric winds over the Pacific ocean, which in turn impact the ocean temperatures and currents.
El Niño and La Niña represent opposite extremes in the El Niño/Southern Oscillation (ENSO). The ENSO cycle refers to the coherent and sometimes very strong year-to-year variations in sea-surface temperatures, rainfall, surface air pressure, and atmospheric circulation that occur across the equatorial Pacific Ocean. El Niño refers to the above-average sea-surface temperatures that periodically develop across the east-central equatorial Pacific. It represents the warm phase of the ENSO cycle. La Niña refers to the periodic cooling of sea-surface temperatures across the east-central equatorial Pacific. It represents the cold phase of the ENSO cycle.
El Niño typically lasts 9-12 months while La Niña typically lasts 1-3 years. They both tend to develop during March-June, reaching peak intensity during December-April, and then weakening during May-July. However, prolonged El Niño episodes have lasted 2 years and even as long as 3-4 years. Due to the peak intensity during the winter months, impacts to the weather patterns are also most noticeable in the winter.
During El Niño, the trade winds decrease, ocean water piles up off South America, the sea surface temperature increases in the eastern Pacific as weak upwelling brings less cold water to the surface, and there is a shift in the prevailing rain pattern from the western Pacific to the western Central Pacific. El Niño can affect weather in the U.S. significantly. The warmer waters cause the Pacific jet stream to move south of its neutral position. With this shift, areas in the northern U.S. and Canada are dryer and warmer than usual. But in the U.S. Gulf Coast and Southeast, these periods are wetter than usual and have increased flooding.
During La Niña, the trade winds increase, ocean water piles up in the western Pacific, the sea surface temperature decreases in the eastern Pacific due to strong upwelling of deep, cold water, and the prevailing rain pattern also shifts farther west than normal. These cold waters in the Pacific push the jet stream northward. This tends to lead to drought in the southern U.S. and heavy rains and flooding in the Pacific Northwest and Canada. During a La Niña year, winter temperatures are warmer than normal in the South and cooler than normal in the North.
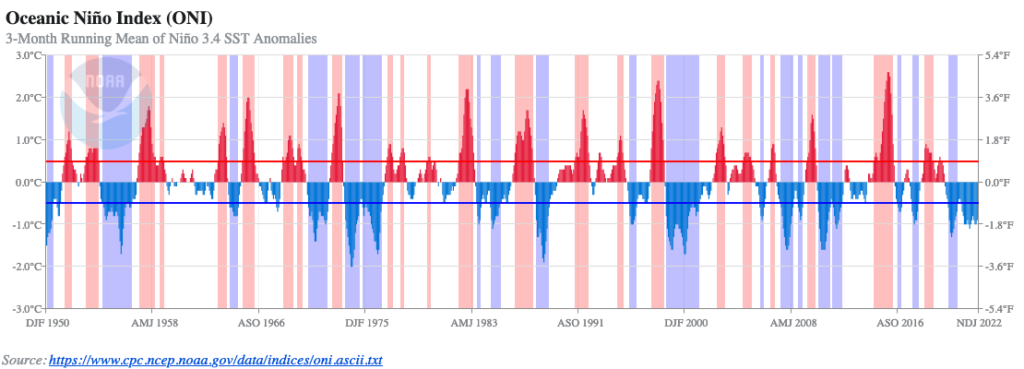
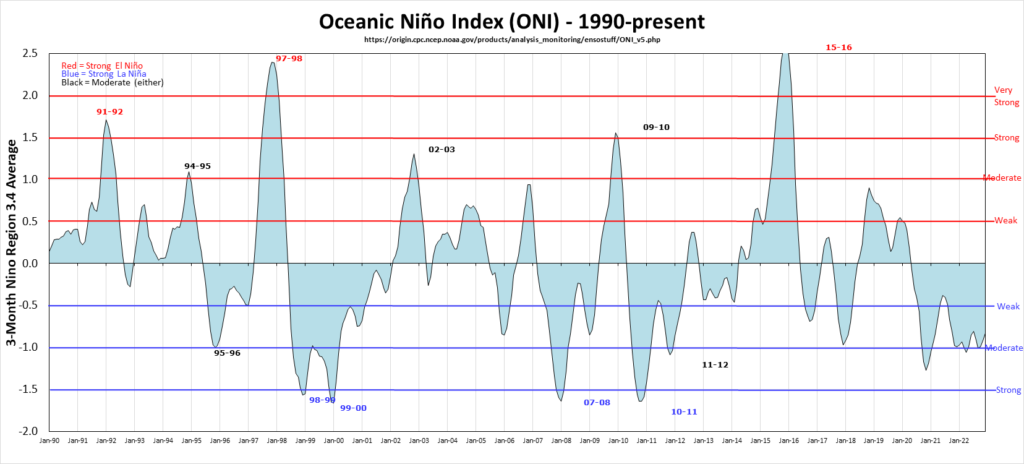
The Oceanic Niño Index (ONI), uses sea surface temperatures to monitor ENSO conditions. Sea surface temperatures are monitored in four “Niño” regions extending from the west coast of South America across the equatorial Pacific. These regions were created in the 1980s, but since then have been modified. Regions 1 and 2 were combined to form the Niño 1+2 region. An overlap of regions 3 and 4 was found to have a good correlation with the SOI, and this region is called Niño 3.4. The Niño 3.4 index and the Oceanic Niño Index (ONI) are the most commonly used indices to define El Niño and La Niña events.
Niño 3.4 (5N-5S, 170W-120W): The Niño 3.4 anomalies may be thought of as representing the average equatorial SSTs across the Pacific from about the dateline to the South American coast. The Niño 3.4 index typically uses a 5-month running mean, and El Niño or La Niña events are defined when the Niño 3.4 SSTs exceed +/- 0.4C for a period of six months or more.
ONI (5N-5S, 170W-120W): The ONI uses the same region as the Niño 3.4 index. The ONI uses a 3-month running mean, and to be classified as a full-fledged El Niño or La Niña, the anomalies must exceed +0.5C or -0.5C for at least five consecutive months. This is the operational definition used by NOAA.

Hadley Circulation, Trade Winds and the ITCZ
The Hadley circulation, or Hadley cell is a worldwide tropical atmospheric circulation pattern that occurs due to uneven solar heating at different latitudes surrounding the equator and causes air around the equator to rise to about 10-15 kilometers, flow poleward (toward the North Pole above the equator, the South Pole below the equator), descend in the subtropics, and then flow back to the equator along the Earth’s surface. This circulation is widely studied by climate scientists because it controls precipitation in the subtropics and also creates a region called the intertropical convergence zone, producing a band of major, highly-precipitative storms.
The Hadley circulation covers almost half of the Earth’s surface area, spanning from roughly the Tropic of Cancer to the Tropic of Capricorn. Vertically, the circulation occupies the entire depth of the troposphere. The Hadley cells comprising the circulation consist of air carried equatorward by the trade winds in the lower troposphere that ascends when heated near the equator, along with air moving poleward in the upper troposphere. Air that is moved into the subtropics cools and then sinks before returning equatorward to the tropics.
The prevailing trade winds are a manifestation of the lower branches of the Hadley circulation, converging air and moisture in the tropics to form the Intertropical Convergence Zone (ITCZ) where the Earth’s heaviest rains are located. Shifts in the ITCZ associated with the seasonal variability of the Hadley circulation cause monsoons. The sinking branches of the Hadley cells give rise to the oceanic subtropical ridges and suppress rainfall; many of the Earth’s deserts and arid regions are located in the subtropics coincident with the position of the sinking branches. The Hadley circulation is also a key mechanism for the meridional transport of heat, angular momentum, and moisture, contributing to the subtropical jet stream, the moist tropics, and maintaining a global thermal equilibrium.
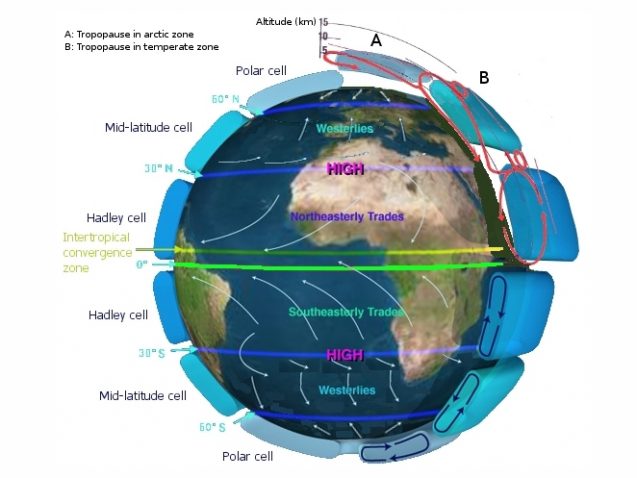
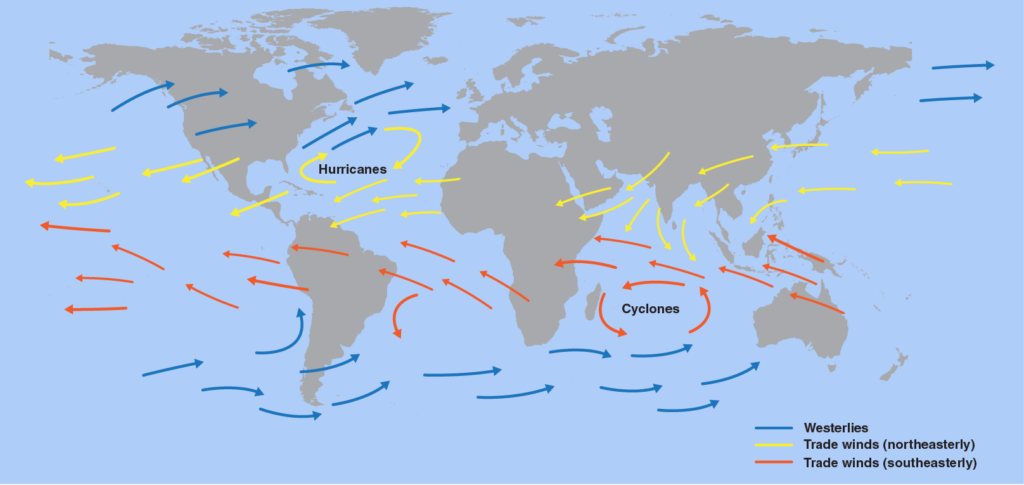
The surface air that flows from the subtropical high-pressure belts between the Hadley cells and the Mid-latitude cells toward the Equator is deflected toward the west in both hemispheres by the Coriolis effect and form the trade winds. In the Northern Hemisphere, the trade winds move in a southwestward direction from the northeast (yellow), while in the Southern Hemisphere, they move northwestward from the southeast (red). Westerlies are located north of the high pressure belt in the Mid-latitude cells.
The trade winds of both hemispheres meet at the Inter-tropical Convergence Zone (ITCZ), also known as the Doldrums. The ITCZ appears as a band of clouds, usually thunderstorms, that encircle the globe near the Equator. The intense sun and warm water of the equator heats the air in the ITCZ, raising its humidity and making it buoyant. Aided by the convergence of the trade winds, the buoyant air rises. As the air rises it expands and cools, releasing the accumulated moisture in an almost perpetual series of showers and thunderstorms. The tendency for convective storms in the ITCZ is to be short in their duration, usually on a small scale. But these short lived storms can produce intense rainfall.
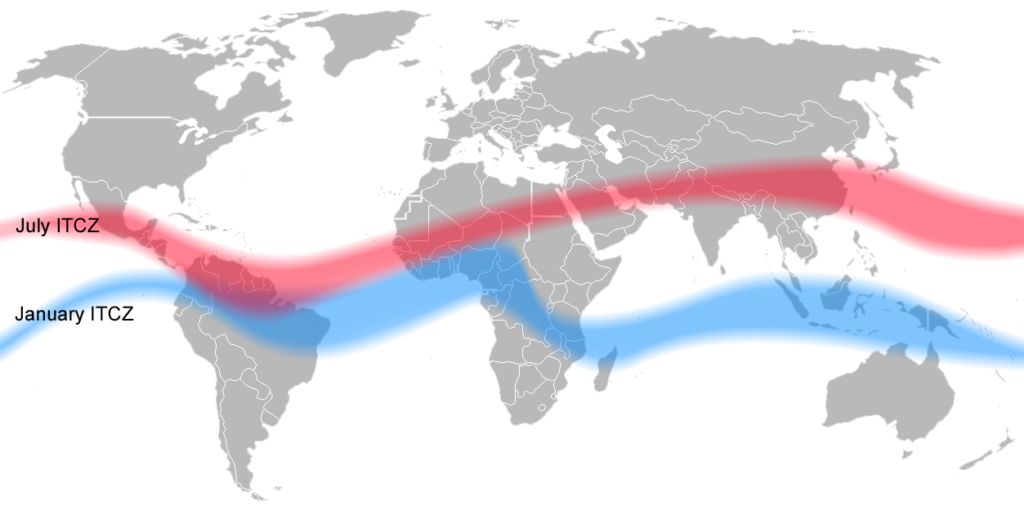
The ITCZ follows the sun in that the position varies seasonally. It moves north in the Northern Hemisphere summer and south in the Northern Hemisphere winter. Seasonal shifts in the location of the ITCZ drastically affects rainfall in many equatorial nations, resulting in the wet and dry seasons of the tropics rather than the cold and warm seasons of higher latitudes. Over the Pacific and Atlantic, the ITCZ can shift 20°–25° of latitude. Over the Indian Ocean, it undergoes especially large seasonal shifts of 40°–45° of latitude.
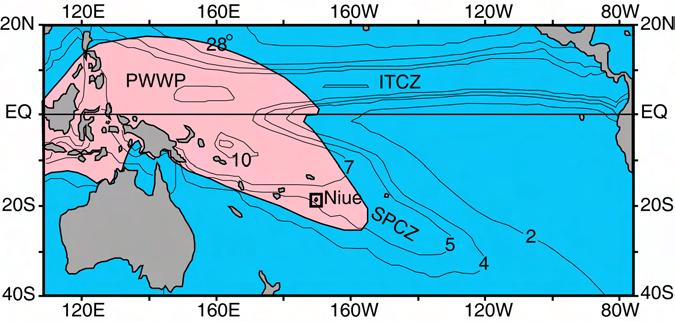
The South Pacific Convergence Zone (SPCZ), a reverse-oriented monsoon trough, is a band of low-level convergence, cloudiness and precipitation extending from the Western Pacific Warm Pool at the maritime continent south-eastwards towards French Polynesia and as far as the Cook Islands (160W, 20S). The SPCZ is a portion of the Inter-tropical Convergence Zone (ITCZ) which lies in a band extending east–west near the Equator but can be more extra-tropical in nature, especially east of the International Date Line. It is considered the largest and most important piece of the ITCZ, and has the least dependence upon heating from a nearby landmass during the summer than any other portion of the monsoon trough.
The SPCZ can affect the precipitation on Polynesian islands in the southwest Pacific Ocean, so it is important to understand how the SPCZ behaves with large-scale, global climate phenomenon, such as the ITCZ, El Niño–Southern Oscillation, and the Interdecadal Pacific oscillation (IPO), a portion of the Pacific decadal oscillation. During El Niño or warm-phase conditions, the SPCZ typically shifted northeastward with dryer conditions on islands to the southwest. Conversely, a southwestward shift in rainfall accompanied La Niña or cold-phase events.
Walker Circulation
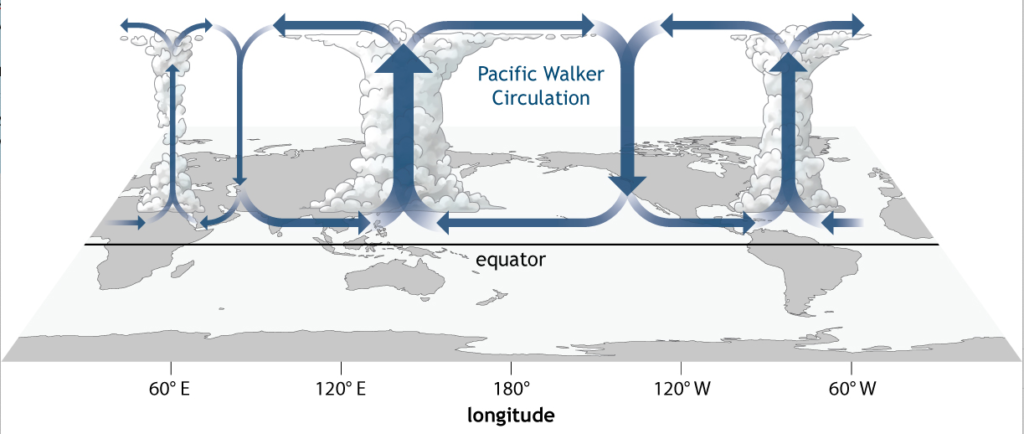
The Walker circulations of the tropical Indian, Pacific, and Atlantic basins result in westerly surface winds in Northern Summer in the Indian basin and easterly winds in the Pacific and Atlantic basins. As a result, the temperature structure of the three oceans display dramatic asymmetries. The equatorial Pacific and Atlantic both have cool surface temperatures in Northern Summer in the east, while cooler surface temperatures prevail only in the western Indian Ocean.
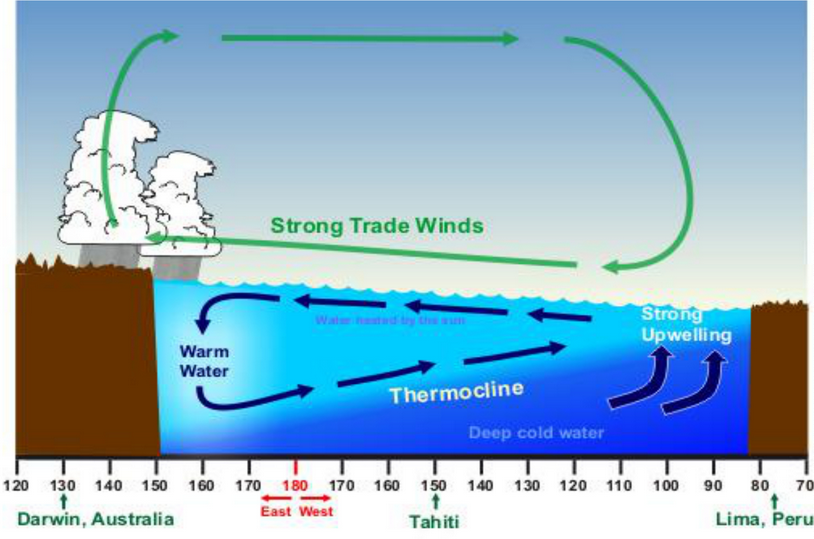
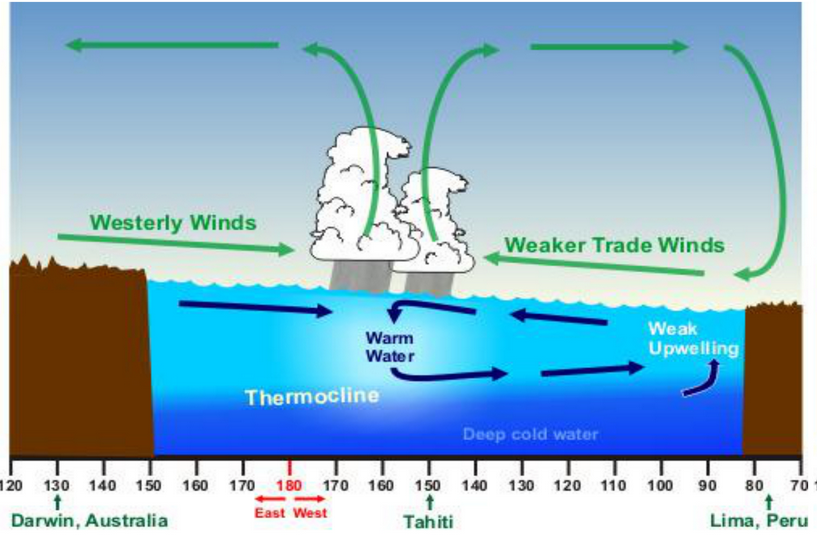
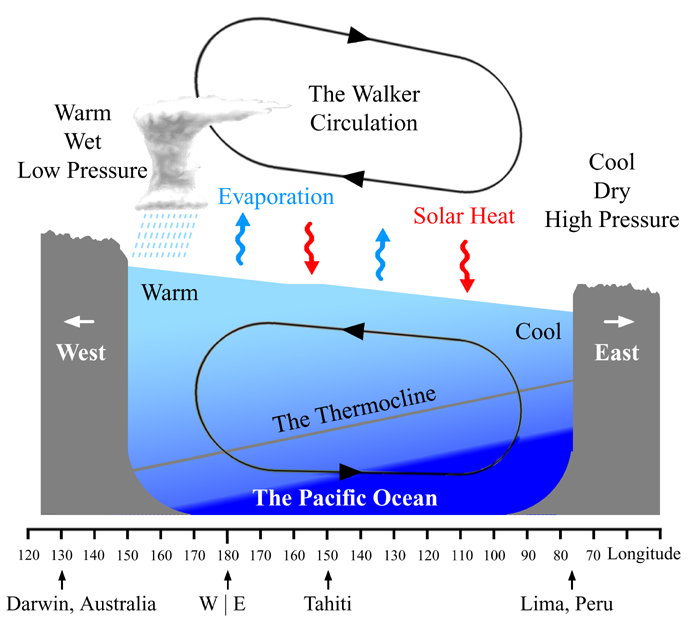
The Walker circulation in the equatorial Pacific is seen at the ocean’s surface as easterly trade winds which move water and air warmed by the sun towards the west. The western side of the equatorial Pacific is characterized by warm, wet low pressure weather as the collected moisture is dumped in the form of typhoons and thunderstorms. This causes the formation of the Pacific Warm Pool. In the western Pacific, water descends and air rises, and both are returned to the east, the water now much cooler and the air much drier. An El Niño episode is characterized by a breakdown of this water and air cycle, resulting in relatively warm water and moist air in the eastern Pacific.
During an ENSO Neutral period, the Walker circulation causes an upwelling of cold deep sea water in the eastern equatorial Pacific, thus cooling the sea surface. El Niño results when this circulation decreases or stops, as the impaired or inhibited circulation causes the ocean surface to warm to above average temperatures. A markedly increased Walker circulation causes a La Niña by intensifying the upwelling of cold deep sea water; which cools the sea surface to below average temperatures.
Sahara Air Layer (SAL)

The Sahara is the largest hot desert in the world, covering almost one-third of the African continent with sandy dunes and some of the hottest temperatures that weather can produce. Venture farther south from the Sahara and the climate gradually shifts from desert to tropical, with summer monsoons driving near-daily thunderstorms and plentiful rainfall. Heavy thunderstorms regularly develop near this transition zone and move west across the continent on prevailing winds. These tropical waves roll into the eastern Atlantic Ocean, where they can slowly develop into tropical cyclones that swirl across the basin. But even as the continent serves as the birthplace of our strongest storms, another hazard blowing off the coast can just as easily kill a budding hurricane before it has a chance to bloom. Dry, sandy winds frequently blow off the Sahara Desert during the summer months, sending mammoth clouds of dust streaking across the Atlantic Ocean. Each sizable puff of hot, dusty air that blows off the continent is known as a Saharan Air Layer (SAL), and these features can severely disrupt the development of hurricanes—and even fill skies over North America with haze and dangerous air quality.
A significant intrusion of Saharan dust over the tropical Atlantic Ocean can alter the environment enough that it stifles tropical cyclone development. The high concentration of dust in the air can reflect sunlight and serve to cool the environment. These desert-borne winds are also very dry, which robs critical moisture that tropical cyclones need to develop and thrive. The combined effects of cooler temperatures and drier air can starve existing storms of the ingredients they need to survive, and the hostile environment stymies tropical disturbances before they have a chance to grow.
Saharan dust can affect hurricane activity in several ways. Dust acts as a shield which keeps sunlight from reaching the surface. Thus, large amounts of dust can keep the sea surface temperatures up to 1°C cooler than average in the hurricane Main Development Region (MDR) from the coast of Africa to the Caribbean, providing hurricanes with less energy to form and grow.
The Saharan Air Layer (SAL) is a layer of dry, dusty Saharan air that rides up over the low-level moist air over the tropical Atlantic. At the boundary between the SAL and low-level moist air where the trade winds blow is the trade wind inversion–a region of the atmosphere where the temperature increases with height. Since atmospheric temperature normally decreases with height, this “inversion” acts to but the brakes on any thunderstorms that try to punch through it. This happens because the air in a thunderstorm’s updraft suddenly encounters a region where the updraft air is cooler and less buoyant than the surrounding air, and thus will not be able to keep moving upward. The dust in the SAL absorbs solar radiation, which heats the air in the trade wind inversion. This makes the inversion stronger, which inhibits the thunderstorms that power a hurricane.
Dust may also act to produce more clouds, but this effect needs much more study. If the dust particles are of the right size to serve as “condensation nuclei”–centers around which raindrops can form and grow–the dust can act to make more clouds. Thus, dust could potentially aid in the formation and intensification of hurricanes. However, if the dust acts to make more low-level clouds over the tropical Atlantic, this will reduce the amount of sunlight reaching the ocean, cooling the sea surface temperatures and discouraging hurricane formation.
Atlantic Multi-Decadal Oscillation
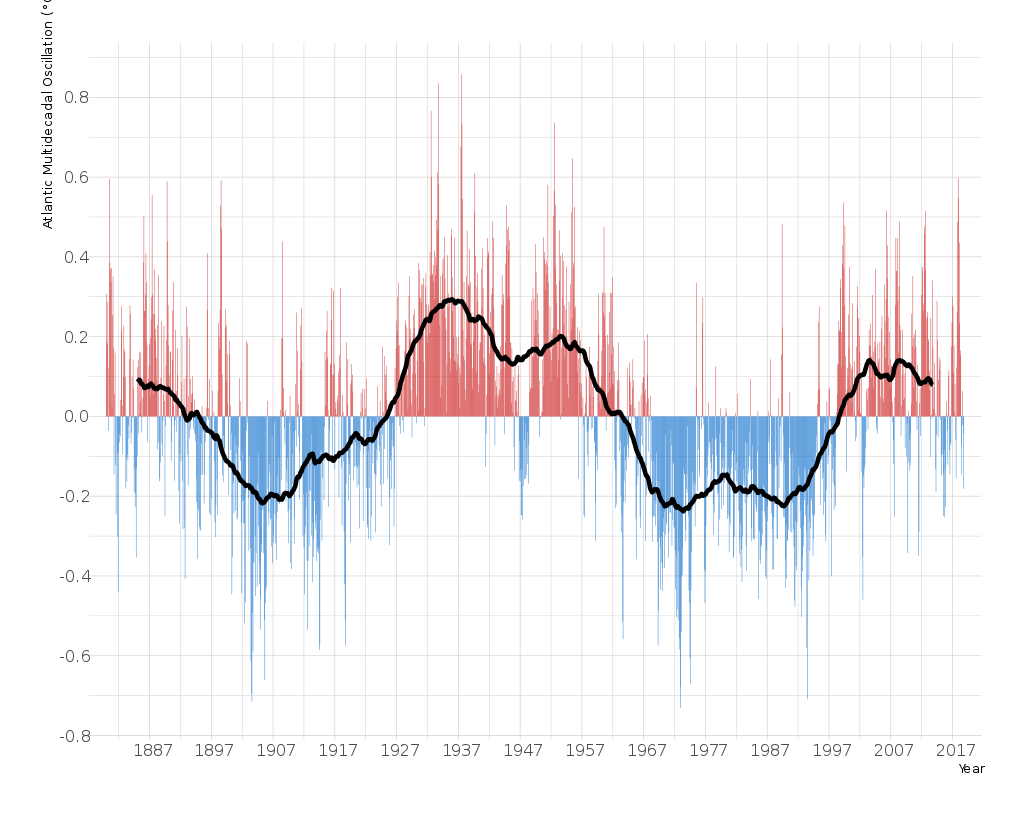
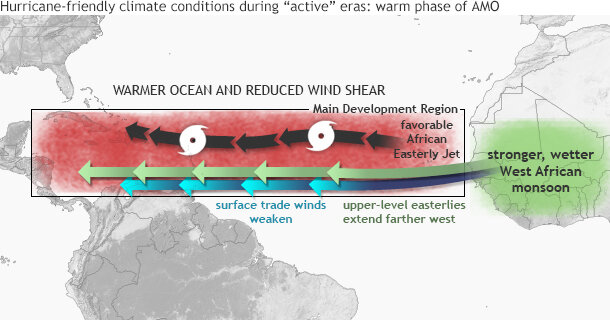
Another prominent climate factor to influence Atlantic hurricane activity is the Atlantic Multi-Decadal Oscillation (AMO) (Goldenberg et al. 2001, Bell and Chelliah 2006). The warm phase of the AMO is associated with high-activity eras for Atlantic hurricanes, such as has been in place since 1995. Conversely, the cold phase of the AMO is associated with low-activity eras (such as the period 1971-1994).
The warm phase of the AMO reflects warmer sea surface temperatures (SSTs) across the Atlantic hurricane Main Development Region. A key atmospheric feature of this pattern is a stronger West African monsoon, which produces a westward extension of the upper-level easterly winds (near 35,000 ft), along with weaker easterly trade winds in the lower atmosphere (near 5,000 ft).
The number of tropical storms that can mature into severe hurricanes is much greater during warm phases of the AMO than during cool phases, at least twice as many; the AMO is reflected in the frequency of severe Atlantic hurricanes. Based on the typical duration of negative and positive phases of the AMO, the current warm regime is expected to persist at least until 2015 and possibly as late as 2035 with an assumed a peak around 2020.
Pacific Decadal Oscillation
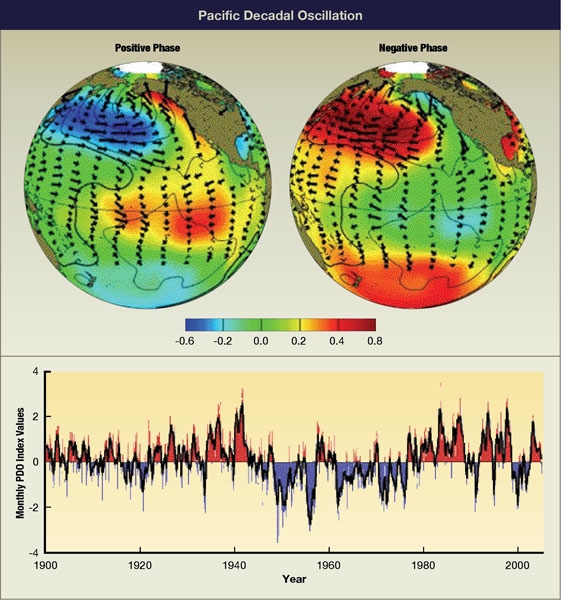
The Pacific Decadal Oscillation (PDO) is a long-lived El Niño-like pattern of Pacific climate variability. While the two climate oscillations have similar spatial climate fingerprints, they have very different behavior in time: first, 20th century PDO events persisted for 20-to-30 years, while typical ENSO events persisted for 6 to 18 months; second, the climatic fingerprints of the PDO are most visible in the North Pacific/North American sector, while secondary signatures exist in the tropics – the opposite is true for ENSO.
Research has shown when PDO is in a warm phase, global temperatures tend to increase and global temperatures tend to cool down when in a cool phase. The ‘cool’ or ‘negative’ phase is characterized by a cool wedge of lower than normal sea-surface heights/ocean temperatures in the eastern equatorial Pacific and a warm horseshoe pattern of higher than normal sea-surface heights connecting the north, west and southern Pacific. In the ‘warm’ or ‘positive’ phase, the west Pacific Ocean becomes cool and the wedge in the east warms.
The PDO spatial pattern and impacts are similar to those associated with ENSO events. During the positive phase the wintertime Aleutian Low is deepened and shifted southward, warm/humid air is advected along the North American west coast and temperatures are higher than usual from the Pacific Northwest to Alaska but below normal in Mexico and the Southeastern United States. Winter precipitation is higher than usual in the Alaska Coast Range, Mexico and the Southwestern United States but reduced over Canada, Eastern Siberia and Australia.
A ‘cool’ phase occurred from 1947 to 1976 (29 years), and a ‘warm’ phase from 1977 to 1999 (22 years). In 1999, we entered into a ‘cool’ phase for about 4 years (1999-2002) followed by a ‘warm’ phase that continued for 3 years. The phase was then neutral until 2007, when we entered into a ‘cold’ phase that lasted through 2013. The last PDO phase shift was in 2014, when it turned strongly ‘warm’.
Over the last hundred years, we have had only a handful of phase shifts, with the amplitude of this climate pattern varying irregularly at interannual-to-interdecadal time scales. However, more recently, the ‘warm’ and ‘cold’ phases have been much shorter.
Pacific Warm Pool
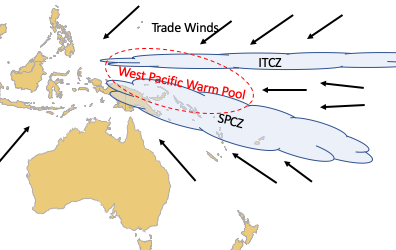
The Pacific Warm Pool (PWP) is characterized by a mean sea surface temperature (SST) exceeding 28 deg C (the minimum surface water temperature that supports deep convection), weak trade winds, and the resultant deep convection, with thunderstorm tops exceeding 15 km. This body of water, which spans the western waters of the equatorial Pacific, holds the warmest seawaters in the world. Because this area of warm water pushes west into the Indian Ocean, it is also often referred to as the Indo-Pacific Warm Pool.
Because these waters are hot enough to drive heat and moisture high into the atmosphere (by convection), the warm pool has a large effect on the climate of surrounding lands. It has been called the “heat engine of the world” and plays a key role in climate and monsoon variability for many nations throughout Asia and Africa and also influences remote regions and large scale climate models of variability. Furthermore, the size and intensity of the warm pool fluctuates with the El Niño–Southern Oscillation (ENSO). During El Nino events, the PWP expands horizontally but shrinks in vertical depth. The opposite occurs during La Nina.
Scientists found that, over a period of roughly two decades, the warm pool’s average annual temperatures and dimensions (the area enclosed within the 28 deg C isotherm) increase and then decrease like a slowly pulsating beacon. Overall in recent years, the PWP has increased in both horizontal coverage and vertical depth. This is believed due to global warming.
How ENSO effects global average temperatures
Within any given decade, the warmest years are usually El Niño ones, and the coldest are usually La Niña ones. Because the Pacific Ocean is a big place (30% of the surface and larger than all the continents combined), this vast size means that warming or cooling in the Pacific due to El Niño and La Niña can leave an imprint on the global average surface temperature. But the surface warming and cooling during El Niño and La Niña don’t involve more or less heat energy entering or escaping the climate system as a whole. In other words, the whole climate system isn’t really cooling or warming. Heat energy that’s already present in the climate system is simply shifting back and forth between the atmosphere (where it shows up in the global surface temperature value) and the deeper layers of the ocean (where it doesn’t).
The changes in sea surface temperatures during El Niño and La Niña are caused and helped along by changes in the trade winds, which normally blow from east to west across the tropical Pacific Ocean. When the trade winds are stronger than normal during La Niña, the winds push more surface water to the western half of the Pacific basin. The pool of warm water grows deeper, storing excess heat at depth, and allowing for colder, deeper water to rise to the surface in the eastern half of the Pacific basin. This wind-driven disturbance creates a large area along the equator where the ocean surface temperatures are below normal. Over the span of months to seasons, heat from the atmosphere then goes into the ocean, leading to cooler air temperatures over a region broad enough to cool down the global average temperature.
During El Niño, when the trade winds are weak or even occasionally reverse themselves, the amount of cold water that comes to the surface is reduced. Warm waters in the west Pacific Ocean slosh to the east. Now there is a large area along the equator where ocean temperatures are above normal. Heat from the ocean then goes out into the atmosphere, leading to warmer air temperatures in the Pacific and subsequently, to warmer global air temperatures (plus a cascade of other impacts). All of this amounts to a shuffling of heat from one place (ocean) to another (the atmosphere) without affecting the Earth’s overall energy budget—the balance between incoming and outgoing energy across the entire planet. So unlike volcanic eruptions, which actually block energy from the Sun from reaching the surface, or solar minimums, which reduce the total amount of energy the Sun emits, the phases of ENSO are not creating or removing energy from the climate system. La Niña hides some of Earth’s existing heat below the surface, while El Niño reveals it. Climate scientists call this kind of re-shuffling internal climate variability.
How ENSO effects the Walker Circulation
What causes ENSO
To quote a rapper, “The Earth’s not a closed system, it’s powered by the sun…”.
Links where much of this information came from:
- https://www.climate.gov/news-features/blogs/enso/impacts-el-ni%C3%B1o-and-la-ni%C3%B1a-hurricane-season
- https://www.lwdd.net/news/el-nino-and-la-nina-explained
- https://reliefweb.int/map/indonesia/pacific-region-historical-storm-tracks-months-nov-apr-1956-2009-different-enso
- https://www.climate.gov/news-features/blogs/enso/walker-circulation-ensos-atmospheric-buddy
- https://en.wikipedia.org/wiki/Hadley_cell
- https://news.climate.columbia.edu/2019/06/24/hadley-cell-climate-modeling/
- https://earthobservatory.nasa.gov/images/703/the-intertropical-convergence-zone
- https://skybrary.aero/articles/western-pacific-warm-pool
- https://ggweather.com/enso/oni.htm
- https://www.noaa.gov
- https://www.climate.gov/news-features/understanding-climate/el-ni%C3%B1o-and-la-ni%C3%B1a-frequently-asked-questions